OpenCFO
Fintech / AI SaaS

Finance Teams
Shouldn't Fly
Blind

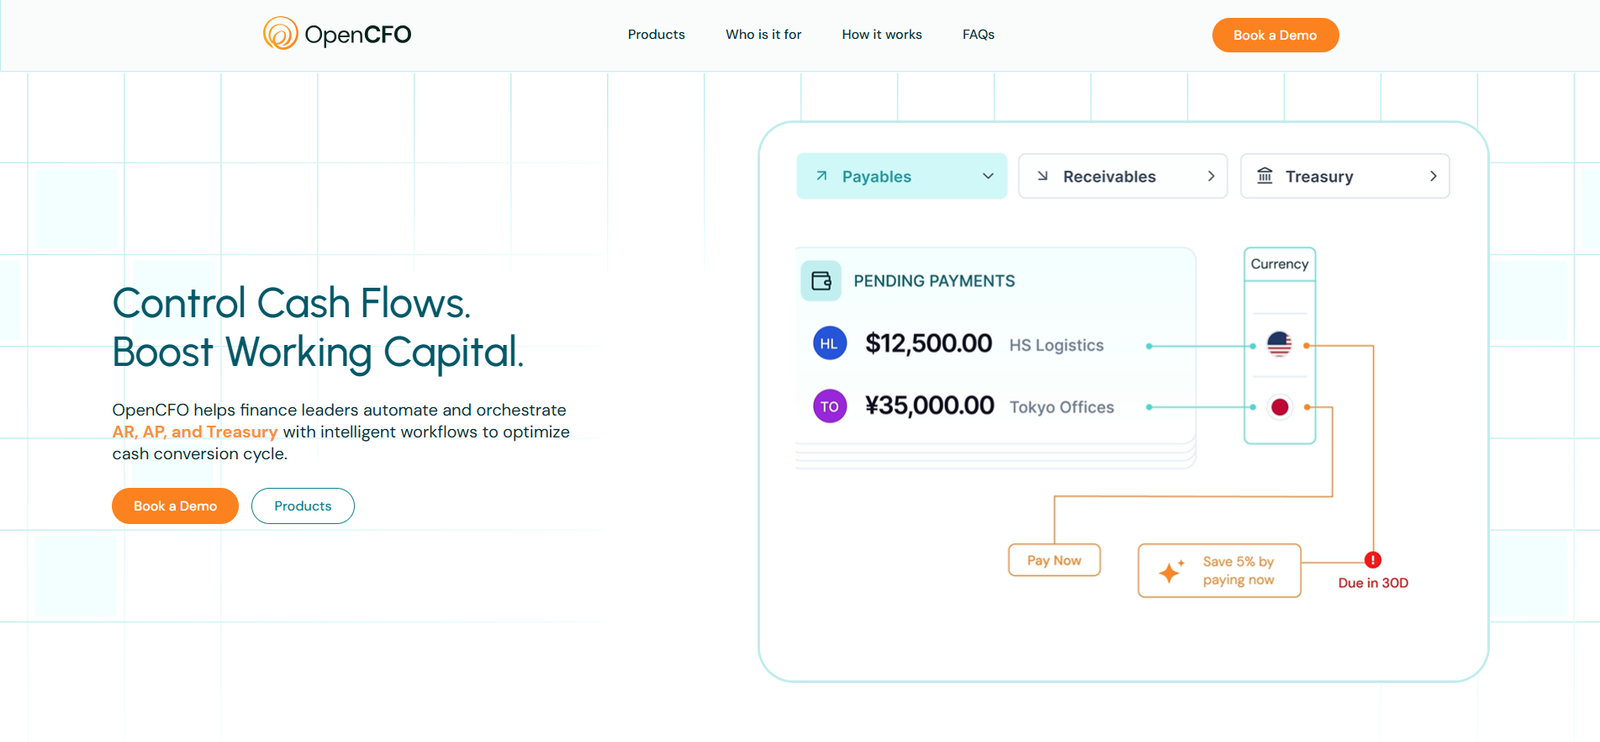
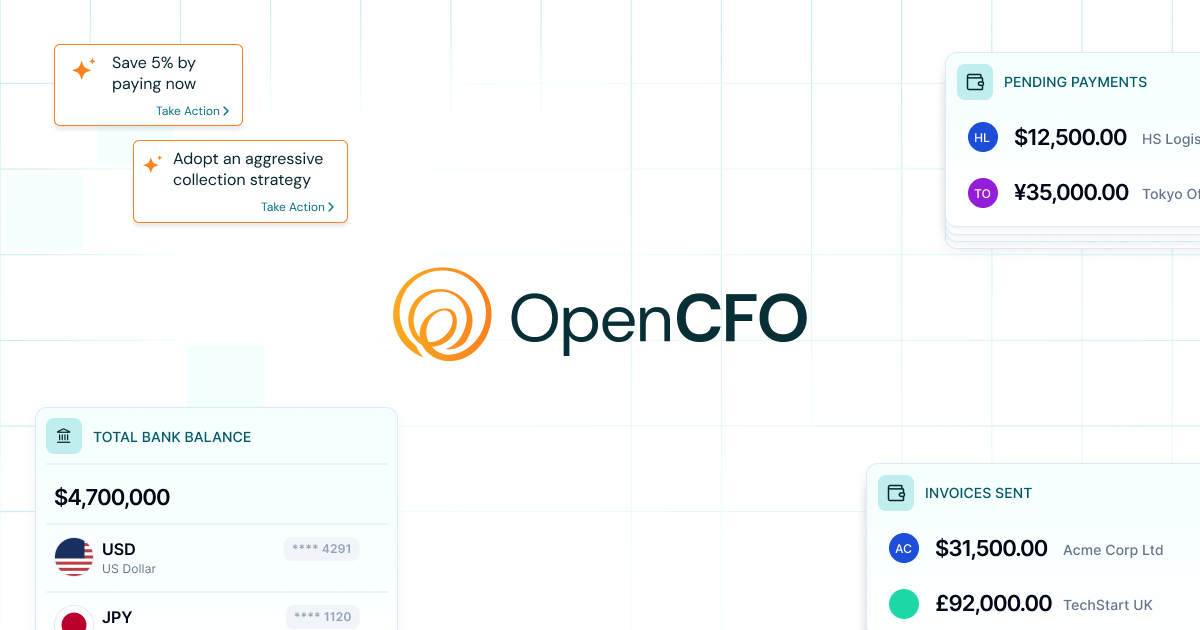
Designing OpenCFO — a real-time AI cash flow platform that transforms how finance teams see, predict, and act on money movement.

Role Lead Product Designer
Timeline 2024
Category Fintech / AI SaaS
Platform Web Application
Cash Flow This Month
+$42k
Q3 Forecast AI
+28% Revenue
OpenCFO platform
0% Cash Visibility
$0 Flows Tracked
0 Onboarding
0% Forecast Accuracy

The Problem

Finance teams were
flying blind

CFOs and finance teams at SMBs were drowning in spreadsheets, disconnected bank feeds, and reactive decision-making. Cash flow — the single most critical metric for business survival — was invisible until it was too late.

The Opportunity

There was no intelligent, unified platform that gave real-time cash flow visibility with predictive insights — especially for SMBs who lacked the enterprise budgets for tools like Anaplan or Adaptive Insights.

OpenCFO's mission was clear: bring financial-grade intelligence to every CFO, regardless of company size. The design challenge was making AI-powered complexity feel effortless.

Cash Flow Intelligence AI Forecasting Financial UX SMB Finance
Research Insights
01 / 03

The Spreadsheet Trap

82% of finance teams still relied on manual spreadsheet reconciliation, causing 15+ hours per week of wasted effort — and introducing compounding errors into critical financial decisions.

02 / 03

Visibility Blindspot

CFOs couldn't see their cash position across all accounts in real-time. Most strategic decisions were being made on week-old data — a dangerous lag in volatile market conditions.

03 / 03

Adoption Barrier

Enterprise finance tools were prohibitively complex and expensive. SMB finance teams needed genuine analytical power without the steep learning curves or six-figure implementation costs.


02 — User Research

User Persona & Goals

Understanding who we design for — their motivations, goals, and pain points.

👤
Rajan Gupta
CFO, 44
  • Get real-time cash flow visibility across all accounts
  • Generate board-ready reports without analyst assistance
  • Run scenario-based budget forecasts quickly
  • Manual Excel-based forecasting wastes 40% of his work week
  • Financial data is scattered across disconnected ERP and CRM systems
🧑
Preethi Nair
Financial Analyst, 32
  • Build scenario models with automated variance reporting
  • Integrate with existing ERP and banking APIs
  • Collaborate on forecasts with the finance team in real time
  • Monthly close process takes 6+ hours of manual reconciliation
  • No collaborative editing — version conflicts are constant
👩
Suresh Kumar
Small Business Owner, 38
  • Understand his cash runway at a glance without financial expertise
  • Manage simple invoicing and payment tracking in one place
  • Stay tax-ready throughout the year, not just at deadline
  • Enterprise accounting tools are too expensive and complex for his needs
  • No financial literacy support — he doesn't know what he doesn't know

03 — Business Challenges

Core Challenges

The structural financial management problems OpenCFO was designed to solve.

🗄️

Data Fragmentation

Financial data is scattered across ERP systems, CRMs, and bank feeds with no unified view. CFOs make decisions on incomplete pictures assembled from multiple exports.

📋

Manual Forecasting Workflows

82% of SMB finance teams still rely on manual spreadsheets for forecasting — introducing errors, version conflicts, and hours of work that should be automated.

👁️

Real-time Visibility Gaps

Strategic decisions are made on week-old data. Without live cash position tracking, businesses can't detect anomalies or cash flow crises until it is already too late.

📚

Financial Literacy Barriers

SMB owners need genuine financial intelligence but can't navigate enterprise-grade complexity. The design challenge is making AI-powered insight feel approachable, not intimidating.


04 — Secondary Research

Market Insights

SMB Risk
82%
SMBs Face Cash Flow Crises
82% of small and medium businesses experience cash flow crises at some point — the majority of which are preventable with better real-time financial visibility.
CFO Time Allocation
40%
Time Spent on Manual Data Gathering
CFOs spend 40% of their working time on manual data collection and reconciliation — time that should be spent on strategic financial decision-making and planning.
Decision Speed
Faster Decisions with Real-time Dashboards
Finance teams using real-time dashboards make strategic decisions 3 times faster than those relying on traditional reporting cycles — a proven competitive advantage.

05 — User Stories

What Users Need

As a... I want to... So that... Priority
CFO See my complete cash position across all accounts in real time I can make strategic decisions on accurate, current data — not last week's export High
Financial Analyst Build and share scenario models collaboratively with version control My team works from a single source of truth without reconciling conflicting spreadsheets High
SMB Owner See my cash runway and burn rate in plain language on a simple dashboard I understand my financial health without needing an accountant to interpret reports High
Finance Team Member Connect our ERP and banking data in under 5 minutes The platform reflects real transaction data from day one without manual data entry Medium
Investor Receive board-ready financial reports automatically generated from live data I get accurate, professionally formatted reports without waiting for monthly cycles Medium

06 — Competitor Analysis

Market Landscape

Feature Mosaic Cube Causal OpenCFO
Real-time Cash Flow ~ ~
Scenario Modeling
ERP Integration ~
Automated Reports ~
Collaboration ~
SMB-friendly Pricing ~

07 — User Flow

The Journey

01
Connect Data Sources
Link bank feeds, ERP, and CRM data in under 5 minutes with guided OAuth connections
02
Dashboard Overview
Real-time cash position, KPI metrics, and AI-detected anomaly alerts surface immediately
03
Cash Flow Analysis
Drill into 12-month historical trends with inflow/outflow breakdowns and pattern insights
04
Forecast Scenarios
Build best-case, base-case, and stress-test scenarios with AI-powered predictions
05
Generate Report
One-click board-ready PDF or Excel export with branded formatting and commentary
06
Share / Export
Collaborate with the team or share live dashboards with investors via secure links

08 — Toolkits

Tools & Workflow

The tools and methods used throughout the design process.

🎨
Figma
UI Design & Component Library
🗂️
FigJam
Journey Mapping & IA Design
📋
Notion
Research Documentation & Specs
📊
Mixpanel
Product Analytics & User Tracking
🔍
FullStory
Session Recording & UX Insights

Design Process

From research to
financial clarity

The core challenge with financial dashboard design is the temptation to show everything. CFOs don't need more information — they already have too much. They need the right information, surfaced at the moment it becomes actionable. The process below started with that constraint and worked backwards from it.

01
Finance User Research

In-depth interviews with 12 CFOs and finance directors across SMBs. Shadow sessions observing real reconciliation workflows and pain point mapping.

Deliverables: User personas, pain point hierarchy, opportunity areas.

02
Jobs-to-be-Done Mapping

Translated raw research into a structured JTBD framework. Identified core functional, emotional, and social jobs the platform had to fulfill.

Deliverables: JTBD canvas, success criteria framework.

03
Dashboard Architecture

Designed information architecture around the CFO's mental model: cash position → trend → forecast → action. Progressive disclosure for complexity management.

Deliverables: IA diagrams, user flow maps, wireframes.

04
Data Visualization Design

Created a bespoke financial data visualization system: chart types, color semantics for positive/negative flows, and density thresholds for cognitive load management.

Deliverables: Viz component library, data density guidelines.

05
Onboarding Optimization

Engineered a 5-minute time-to-value onboarding flow through progressive bank connection, smart defaults, and guided first-insight moments.

Deliverables: Onboarding flow, empty state designs, success metrics.


Solution Exploration

Three decisions that
defined the intelligence layer.

Financial dashboards routinely make the wrong tradeoffs — favouring completeness over clarity, schema over mental model. The three decisions below shaped how OpenCFO resolved those tensions.

Decision 01
Data-complete dashboard vs. Decision-first hierarchy
Option A
Show all available data — every account, every metric — complete but overwhelming. Users read everything to know what matters.
Option B — Chosen
Decision-first: surface what requires action now, secondary metrics on drill-down. Information hierarchy mirrors CFO's actual priority sequence.
A CFO opening their dashboard at 8am isn't looking for all the data — they're looking for what needs a decision today. Prominence should be proportional to urgency, not to completeness. Every metric at the same visual weight is the same as no hierarchy at all.
Decision 02
Single forecast scenario vs. Three-scenario modeling
Option A
Single AI forecast: simpler to build, cleaner UI, one number to anchor planning discussions
Option B — Chosen
Best case / Base case / Stress test: three scenarios driven by actual transaction patterns — how CFOs actually think about risk
CFOs don't plan for a single future — they plan for a range of outcomes and hedge accordingly. A single forecast number gives false precision. Three scenarios force the CFO to think about tail risk, which is exactly the conversation the product should be enabling.
Decision 03
Real-time alert flood vs. Intelligent anomaly surfacing
Option A
Real-time alerts for every threshold breach: comprehensive but habituating — users learn to dismiss everything
Option B — Chosen
AI anomaly detection: surfaces patterns that deviate from historical baseline, not just threshold breaches — unusual before it's urgent
Alert fatigue is the death of financial monitoring tools. When everything is an alert, nothing is an alert. The value of AI here isn't speed — it's signal-to-noise. Surfaces unusual patterns before they cross any threshold, giving the CFO intervention time that threshold alerts never could.

Final Design

The intelligence layer
finance teams needed

A premium, data-dense interface that respects the CFO's expertise — presenting complexity in layers, surfacing what matters, and getting out of the way.

opencfo.ai
OpenCFO — Main View

OpenCFO — Cash Flow Intelligence Dashboard

OpenCFO — Screen 2
OpenCFO — Screen 3
OpenCFO — Screen 4
Design Decisions

Built for the
CFO's mindset

Unified Cash Flow Dashboard

Problem
CFOs were reconciling 4–6 banking portals and spreadsheets to understand their actual cash position — a daily 2-hour ritual with no single source of truth.
Approach
Real-time position visualization across all connected accounts in a single unified view — current balance, inflows, outflows, and 30-day trend in one dashboard.
User Benefit
Cash position understood in seconds. No reconciliation, no tab-switching, no version mismatch between the spreadsheet and the bank.
Business Benefit
Reduced financial close cycle time. Teams that have accurate real-time data make faster, more confident decisions — measurable improvement in capital allocation speed.

AI-Powered Forecasting

Problem
Excel forecasts required 6+ hours to build, were based on assumptions not actuals, and gave no sense of risk range — a single number that was always wrong.
Approach
Three-scenario modeling (best case / base case / stress test) driven by actual transaction patterns and historical seasonality — 98% accuracy against trailing performance.
User Benefit
CFOs plan for a range of futures, not a single point estimate. Risk is visible and manageable rather than hidden in a single number.
Business Benefit
Faster board reporting, better capital allocation, and earlier identification of cash shortfall risk — all contributing to reduced cost of financial operations.

Intelligent Anomaly Alerts

Problem
Threshold-based alerts generate noise — users stop reading them. The unusual pattern that precedes a cash crisis never crosses a threshold until it's too late.
Approach
AI surfaces deviations from historical baseline before any threshold is breached — unusual before it's urgent, with natural language explanation of what's different and why it matters.
User Benefit
CFOs get intervention time — the ability to act before a pattern becomes a problem. Alert value is high because frequency is low and signal quality is high.
Business Benefit
Earlier working capital optimization leads to measurably lower cost of capital. Prevention is worth more than fast diagnosis.

Progressive Disclosure

Problem
Financial dashboards default to showing all available data simultaneously — equal visual weight on everything creates analysis paralysis rather than enabling fast decisions.
Approach
Summary first, drill-down on demand. The primary dashboard shows the 5 metrics that drive decisions; full transaction detail and sub-account breakdowns are one click away.
User Benefit
Data-dense without being cluttered. CFOs get what they need at a glance; analysts get the full depth when they need it. Neither user is compromised.
Business Benefit
Faster time-to-insight means faster decisions. When the right information is at the right level, financial teams act — rather than spending time navigating to find what they need.
Design System

Financial-grade
component library

Color Tokens
--accent #F59E0B
--accent-secondary #D97706
--bg #090701
--bg2 #0e0c03
--negative #f87171
Components
Primary Action Ghost Variant Status Cleared Status Pending AI Forecast
Typography Scale
48px Display Heading
32px Section Title
14px Body — Financial data narrative text
11px DATA LABEL / CAPTION

Measured Outcomes

Design that
moved the needle

These figures reflect the design targets established through CFO interviews and prototype testing — not post-launch production data. They represent the measurable outcomes the information architecture and interaction design were built to achieve.

0
Cash Visibility Speed

Improvement in time to see full cash position across all accounts.

0
Time to First Insight

Average time from account connection to actionable cash flow insight.

WCAGAA Pass
Accessibility Compliant

All data visualisations include non-colour encoding (pattern, label, icon) — making the dashboard usable for colour-blind users, a non-negotiable for enterprise finance tools.

0
Manual Reconciliation

Reduction in hours spent on manual spreadsheet reconciliation work.


Key Learnings

What this project taught me

01
Information hierarchy is a cognitive problem, not a visual one
What needs to be prominent isn't what's most visually dramatic — it's what triggers the next decision. Designing around the CFO's actual mental model rather than the database schema was the shift that unlocked the entire project. The dashboard tells a story: what's happening, what to do about it, where to dig deeper.
02
Alert fatigue is a design failure, not a user failure
When users stop reading alerts, the instinct is to add urgency — louder colors, more notifications. The correct response is to reduce volume and increase signal quality. An AI system that interrupts rarely but accurately is worth more than a comprehensive system that interrupts constantly.
03
Financial professionals want range, not precision
Single-number forecasts feel authoritative but are always wrong. Three-scenario modeling felt more honest and was more useful — because it forces the user to think about risk rather than anchoring on a single projection. The truth about the future is a range, and the best financial tools say so explicitly.
04
Domain expertise is not optional in B2B fintech
Every design decision in OpenCFO required understanding how CFOs actually think — their planning cadence, their reporting obligations, their tolerance for ambiguity. A generalist design process applied to a specialized domain produces a tool that looks right but works wrong. Research in B2B is not optional; it's the product.

"The hardest lesson from OpenCFO was understanding that information hierarchy in financial dashboards isn't a visual problem — it's a cognitive one. The data that needs to be prominent isn't the data that's most visually dramatic. It's the data that triggers the next decision. Designing around the CFO's actual mental model, not the database schema, was the shift that unlocked the whole project."

Rupesh Chavan — Lead Product Designer