Supply Chain / B2B SaaS
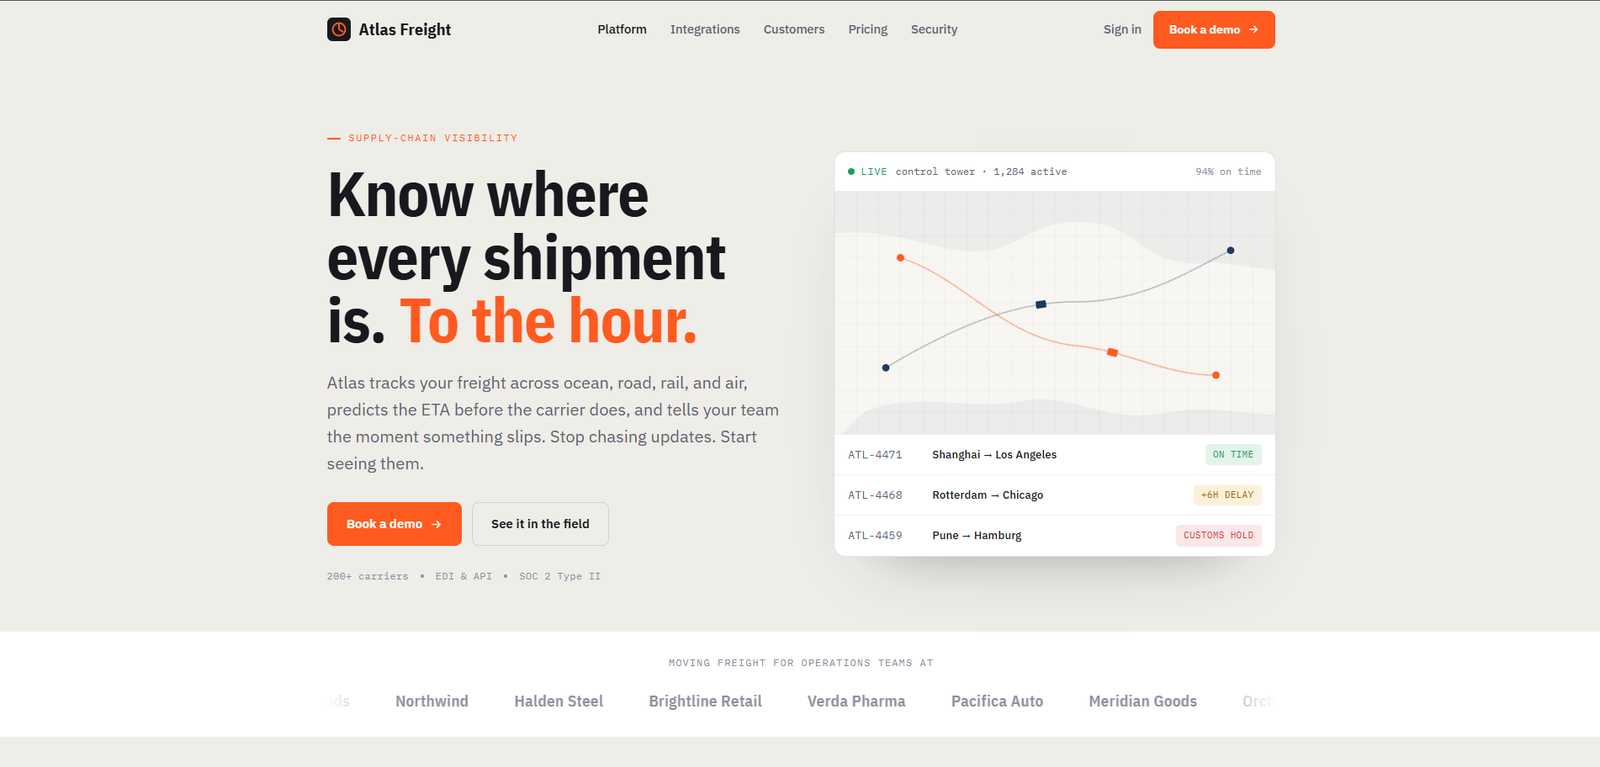
Freight That Knows
Where It Is

Atlas Freight is a real-time supply-chain and freight visibility platform that unifies ocean, road, rail, and air carriers into one control tower — live tracking, predictive ETAs, exception alerts, and a unified inbox across every EDI and API integration.

Role Senior Product Designer
Timeline 2025
Category Logistics / B2B SaaS
Type Marketing Website
Atlas Freight — Platform Overview
40+ Carriers Connected
4 Transport Modes
<2min Exception Alert
99.9% Uptime SLA

01 — The Problem

You're always one call away
from "we don't know."

The Challenge

Logistics teams at mid-market importers and 3PLs operate across dozens of carrier portals, EDI feeds, and email threads. A single shipment can touch four modes and six handoffs — and each handoff is a potential blind spot. When a container goes dark at a transshipment port, someone has to call. That someone is always a person, and that call is always too late.

Atlas Freight needed a platform and a marketing presence that communicated the single most important thing: you will know before anything goes wrong.

The Design Problem

How do you design a control tower that feels like a command centre rather than a spreadsheet? How do you communicate multi-modal complexity without overwhelming the COO who just needs to know if the November shipment will clear customs on time?

Every design decision — the hazard-orange exception system, the unified inbox, the predictive ETA engine — had to answer a single operational question: does this help me act, or does it just inform me?

Research Insights

INSIGHT 01
Carrier Fragmentation
The average logistics director manages 8–12 carrier portals, each with different login credentials, status vocabularies, and update cadences. The problem isn't data — it's the cost of aggregating it manually, every day, across every mode.
INSIGHT 02
Exception Blindness
Exceptions — port congestion, customs holds, weather delays — are discovered reactively, not proactively. Teams learn about problems when customers call, not when the system flags them. The design intervention is a real-time alert layer that reverses the information flow.
INSIGHT 03
Ops Credibility
The COO's credibility in a supply chain crisis depends on knowing more than the carrier. When the primary COO-level fear is "my customer knows before I do," visibility becomes a business risk — not just an operational inconvenience. Atlas needed to solve for credibility, not just efficiency.

02 — User Research

The people who need to know

Atlas serves operations leadership at mid-market importers and third-party logistics providers — professionals who make high-stakes decisions in real time and can't afford a 3-hour data lag. Two personas defined the product's core design language.

Marcus Webb
Marcus Webb
COO at Mid-Market Importer
  • Live ETAs on every active shipment — no calls to freight forwarders
  • Exception alerts before customers call about delays
  • Carrier performance benchmarks for quarterly business reviews
  • Managing 6 separate carrier portals with different update formats
  • 3-hour average lag on shipment status updates
👩‍💼
Ayesha Okonkwo
VP Operations at 3PL
  • Multi-modal visibility in a single pane — ocean, road, rail, air
  • API-first integration that works with their existing TMS
  • SLA reporting that proves on-time performance to clients
  • Manual check-calls consuming 30% of operations team time daily
  • No unified exception view across client shipments

03 — Design Process

From fragmented portals
to control tower clarity.

Industrial data products fail when they try to be everything at once. The process for Atlas started with a constraint: the platform should surface the exception first, the full picture second. Every phase tested against that principle — if a design decision made exceptions harder to see, it was cut.

01
Discovery & Research
Mapped the existing logistics tech stack at three target accounts. Documented carrier portal UX, EDI message formats, and the daily workflows of logistics coordinators. Identified the check-call as the single highest-cost ritual — and the primary design target.
02
Information Architecture
Defined a four-layer hierarchy: Board (fleet-wide status) → Shipment (single journey) → Event (milestone) → Message (carrier comms). Every navigation decision was evaluated against time-to-exception: how many clicks to see what's at risk right now?
03
Visual System
Built around operational semantics, not aesthetics. Hazard orange (#FF5A1F) for exceptions and active alerts. Blueprint navy for background hierarchy and structural elements. Green for on-time. Red for critical delay. The system reads like a control room — no decoration that competes with signal.
04
Component Build & Handoff
Delivered a complete component library: status chips (5 states), the Control Tower table, the Shipment Timeline, and the Live Route Map. Handoff documentation included interaction states, accessibility notes, and integration data contracts for the engineering team.

Solution Exploration

Three decisions that
shaped the platform.

Decision 01
Data-complete fleet view vs. Exception-first control tower
Problem
Logistics operations generate enormous data volume — every event, every handoff, every carrier message. The instinct is to surface all of it so nothing is missed.
Option A — Data-Complete View
Show every shipment, every status, every milestone in a comprehensive table. Maximum information density. The exception is visible — if you filter for it.
Option B — Exception-First (Chosen)
Exceptions surface as primary UI — pulsing pins on the map, coloured rows at the top of the table, alert counts in the nav. At-risk and delayed shipments are the first thing visible, not a filter away.
Why Option B
A table full of green "On Time" rows with one red exception buried at row 47 is a failed interface. The logistics manager needs to see what requires action — everything else is noise until it isn't.
Reasoning: In operational software, the interface exists to surface what demands action. A data-complete view treats every row as equal — exception-first treats the critical row as the only one that matters right now.
Decision 02
Colour-only status encoding vs. Semantic multi-channel status chips
Problem
Logistics status needs instant recognition across five states. Colour is the fastest channel — but colour-only encoding fails for the 8% of users with colour vision deficiency, and fails in high-ambient-light environments.
Option A — Colour Only
Green = on time, orange = at risk, red = delayed, amber = customs, grey = delivered. Fast, clean, industry convention — and inaccessible to colour-blind coordinators.
Option B — Semantic Status Chips (Chosen)
Five chips combining colour, dot indicator, and text label: On Time, At Risk, Delayed, Customs Hold, Delivered. Three encoding channels for each state — colour, shape, and label — ensuring recognition regardless of colour perception.
Why Option B
A freight coordinator missing a "Delayed" status because they can't distinguish orange from red is an operational failure with real financial consequences. The chips make status unmissable for every user.
Reasoning: In high-stakes operational software, accessibility is a business continuity requirement — not a compliance checkbox. An interface that fails for any user fails the operation.
Decision 03
Text-based ETA updates vs. Visual shipment timeline with predictive markers
Problem
Supply chain stakeholders — COOs, coordinators, customer service — all ask the same question in different contexts: "where is this shipment and when will it arrive?" Text ETA fields answer it, but don't communicate the shape of the delay.
Option A — Text ETA Field
"ETA: 14 Nov — 2 days delayed." Accurate, compact, scannable in a table. Doesn't show where in the journey the delay occurred or what caused it.
Option B — Horizontal Timeline (Chosen)
Event rail from booking to delivery with predictive ETA markers updating in real time. Delays render as red segments; customs holds as amber. The shape of the delay is visible — not just its duration.
Why Option B
A 2-day delay caused by a customs hold at Rotterdam requires a different response than a 2-day delay caused by a vessel departure miss. The timeline communicates cause alongside duration.
Reasoning: Operational decisions require context, not just data. A timeline that shows where the delay occurred enables the right intervention — a text field only tells you the shipment is late.

04 — Design System

A control tower
built for operations.

The Atlas design system is built around one principle: signal before noise. The hazard-orange exception layer is always visible. The status chip vocabulary is consistent across all four transport modes. The Control Tower table is the command centre — sortable by risk, ETA deviation, or carrier — so the logistics director sees what needs attention without scanning every row.

app.atlasfreight.io — Control Tower
Live
Atlas Freight — Control Tower Dashboard

Atlas Freight — Control Tower Dashboard

app.atlasfreight.io — Shipment Timeline
Atlas Freight — Shipment Timeline
app.atlasfreight.io — Integrations
Atlas Freight — Integrations

Signature Components

🗺️
Live Route Map
Problem
Logistics portals show shipment status as text fields in a table — no spatial context for where a vessel is, what leg it's on, or why a delay is happening at a specific point in the route.
Approach
Real-time vessel, truck, and rail positions on a dark cartographic canvas — each leg colour-coded by transport mode, exceptions as pulsing orange pins. Visible immediately, not buried in a table row.
User Benefit
Operations managers see the physical reality of the shipment network at a glance. The map answers "where is everything?" in seconds — without navigating between carrier portals.
Business Benefit
The live map is the most visually distinctive element in a category that defaults to table-only interfaces. It is the feature that earns the "control tower" framing — and the demo moment that closes enterprise deals.
Shipment Timeline
Problem
Text ETA fields tell you a shipment is delayed — not where in the journey the delay occurred, what caused it, or how it is propagating through the remaining legs.
Approach
Horizontal event rail from booking to delivery with predictive ETA markers updating in real time. Delays render as red segments; customs holds as amber — the shape of the delay is visible alongside its duration.
User Benefit
A 2-day delay caused by a customs hold at Rotterdam requires a different intervention than one caused by a vessel miss. The timeline communicates cause alongside effect — enabling the right response immediately.
Business Benefit
The timeline is the single source of truth that replaces the email threads, portal-switching, and carrier calls that currently consume coordinator time. Time saved per shipment exception compounds across fleet volume.
🏷️
Status Chips
Problem
Five shipment states (On Time, At Risk, Delayed, Customs Hold, Delivered) need instant recognition across all views. Colour-only encoding fails for colour-blind coordinators and in high-ambient-light environments.
Approach
Semantic chips combining colour, dot indicator, and text label — three encoding channels per state. Status is unmissable regardless of colour perception, screen brightness, or viewing angle.
User Benefit
Every coordinator sees every status correctly, every time. No misread status chips means no missed exceptions — the most operationally critical failure mode is designed out.
Business Benefit
Consistent chip language across map, timeline, and table reduces the cognitive load of switching between views. Coordinators learn one status vocabulary that works everywhere in the product.
On Time At Risk Delayed Customs Hold Delivered
Control Tower Table
Problem
Fleet management requires the same data at different altitudes: the COO needs weekly exception summaries; the coordinator needs daily granular status. A single table optimised for one fails the other.
Approach
Master fleet table sortable by exception severity, ETA deviation, carrier, or origin. Inline status chips, carrier logos, and ETA delta values — full picture at a glance, no drill-down required to see what's at risk.
User Benefit
COO and coordinator both get what they need from the same view. Exception-first sorting means the most critical shipments are always at the top — whether you're reviewing 10 or 10,000 rows.
Business Benefit
A single control tower view that works at all altitudes eliminates the need for separate executive dashboards and operational reports — reducing implementation complexity and training overhead.

Integration Ecosystem

Atlas connects to ocean, air, road, and ERP systems via EDI and REST APIs — reducing integration time from weeks to days.

ERP
Air
Ocean
Rail

Used by operations teams at


05 — Outcomes

Visibility that
drives action.

Atlas delivers measurable outcomes for operations teams — not just a better interface, but a platform that changes the daily workflow from reactive check-calls to proactive exception management.

4
Transport Modes
Ocean, road, rail, and air unified in a single control tower view — no mode-switching, no separate portals.
Real‑Time
Shipment Status
Live carrier data via EDI and API — replacing 3-hour lag with sub-minute position updates across 40+ carrier networks.
<2min
Exception Alerts
Operations teams receive exception notifications before customers are impacted — reversing the reactive information flow that defines legacy logistics software.
40+
Carrier Integrations
Pre-built carrier connectors cover the major ocean, air, and road networks — reducing integration implementation from months to days.

Key Learnings

What This Project Taught Me

01
Restraint is the hardest discipline in industrial data design
Logistics operations produce enormous amounts of data — every event, every handoff, every carrier message. The temptation is to show all of it. The right answer is to show only what demands action. Atlas works because it treats exceptions as primary UI, not as a secondary filter on a table full of green rows. The discipline required to remove a data field that is "useful sometimes" is much harder than adding it — and much more important.
02
Operational vocabulary is a design problem
The hardest design conversation in this project wasn't about the interface — it was about what "at risk" means. A 3PL COO and a freight coordinator have different thresholds for what constitutes an exception. That vocabulary disagreement changed how we calibrated alert thresholds, which changed the colour system, which changed the entire exception layer. Product design in logistics is as much about operational semantics as it is about UI — and you cannot design the right interface until you have resolved the language question first.
03
In operational software, accessibility is a business continuity requirement
A freight coordinator missing a "Delayed" status because they cannot distinguish orange from red is not a UX problem — it is an operational failure with direct financial consequences. The semantic status chip system (colour + dot + label) was not designed as a compliance exercise. It was designed because the cost of misread status in a logistics operation is a missed exception, a delayed intervention, and a penalty clause. Accessibility in industrial software has stakes that most products do not.
04
The interface that works at all altitudes earns the enterprise
The control tower table needed to serve the COO reviewing weekly exception summaries and the coordinator managing daily granular status — simultaneously, from the same view. Designing a single interface that works at both altitudes is harder than designing two separate views, but it eliminates a class of implementation complexity that typically blocks enterprise deployment. The insight: when the interface works for the most demanding user at the most demanding frequency, every other user's needs are already covered.

06 — Reflection

"Designing industrial data interfaces taught me that restraint is the hardest discipline. Logistics operations produce enormous amounts of data — every event, every handoff, every carrier message. The temptation is to show all of it. The right answer is to show only what demands action. Atlas works because it treats exceptions as primary UI, not as a secondary filter on a table full of green rows."
— Rupesh Chavan, Lead Product Designer
"The hardest design conversation in this project wasn't about the interface — it was about vocabulary. What does 'at risk' mean to a 3PL COO versus a freight coordinator? The answer changed how we calibrated alert thresholds, which changed the color system, which changed the whole exception layer. Product design in logistics is as much about operational language as it is about UI."
On designing for operational semantics in industrial software